How to use UTM parameters for subscription revenue attribution
Published June 2020
Published Jun 2020
Updated June 2020
Updated Jun 2020
4 min read

AI Summary
Marketers have been using UTM parameters for decades to track the effectiveness of their campaigns. In an increasingly competitive ecommerce world, it is more important than ever that a business understands the effectiveness of its marketing tactics.
Marketers have been using UTM parameters for decades to track the effectiveness of their campaigns. In an increasingly competitive ecommerce world, it is more important than ever that a business understands the effectiveness of its marketing tactics.
We are ecstatic to announce that Recharge now supports media attribution via UTM parameters within the built-in Analytics suite. We are helping you take analytics a step further by allowing you to attribute marketing activities to your Recharge recurring revenue, active customer count, and engagement.
If you’ve never worked with UTM parameters and want to understand why it’s a best-practice for nearly all marketing professionals, check out Neil Patel’s “The Ultimate Guide to Using UTM Parameters.”
Before we start
Enabling UTM parameters on your Recharge store is a turn-key solution once it is set up correctly. It requires a few pieces of code to be updated in the cart footer to allow the values from your Shopify cookie to be automatically attributed back to your Recharge analytics suite.
Additionally, UTM parameters will not backfill from previous marketing campaigns, we can only track new data coming in. We recognize the data will only be useful after results from a number of campaigns are analyzed. Therefore, even if you don’t anticipate using UTM parameters now, we suggest you update the cart footer to make sure you have the data when you want it.
Requirements:
In order to use UTM parameters with Recharge, you must be using Recharge Version 3.2 (updated on December 13, 2019) or later of the subscription-cart-footer.liquid file. The file can be manually updated by following these instructions or the Recharge Support Team can make the necessary changes if you email [email protected].
How does our technology work?
Our goal was to build a merchant-facing tool to show the impact of marketing campaigns and media spend on recurring revenue, customer acquisition, and overall lifetime value. Designed with ease-of-use in mind, this new tool will provide visibility into your acquisition and retention funnels to help understand return on ad spend (ROAS). Less time compiling data allows for more time to analyze your business and invest in scaling via the advertising platforms or marketing tactics of choice.
Functionality and examples
Attribution summary and attribution KPIs can give us both high level and more granular insights into how these sources impact the merchant’s recharge business.
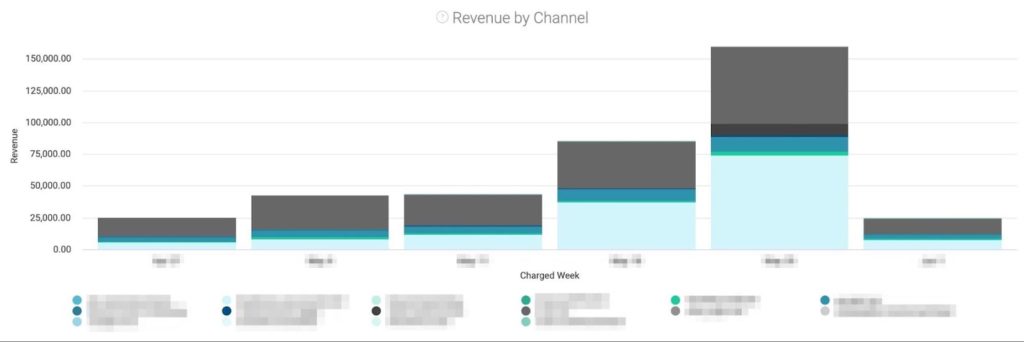
Revenue by channel:

Each channel is noted by a unique color and visually highlights the total dollars of each. You also have the ability to drill into each weekly section to see individual daily data.
KPIs by channel:

Dive deeper into individual channels and analyze data points like total revenue, average order value (AOV), average customer value (proxy for LTV), and even refunds.
How to use UTM parameters for Recharge

The above data is pulled from a Recharge demo store to highlight examples of how to use the new functionality within the Analytics suite.
If we look at rows 5 and 6, we see that email marketing yields significantly higher AOV and lower churn. This is as to be expected because remarketing campaigns are usually designed to increase value from existing customers. However, remarketing campaigns also capture lower volume in terms of revenue and active customers.
Rows 1 and 2 show organic traffic and paid social media which has the highest revenue attributed to it. These two sources have the most active customers coupled with relatively low customer churn.
Rows 4, 7, 8, and 9 highlight blogs and newsletters which are top contributors to the recurring revenue stream. However, the audience that comes through these channels show high churn and lower AOV which also signals low LTV.
Merchants often use these insights to allocate media dollars away from low-performing sources and invest more in high-performing sources. The new Recharge UTM parameters dashboard allows you to monitor how changing spend distribution impacts the underlying metrics that contribute to ROAS.
Closing
Recharge merchants had been piecing together bits of technology to understand where their marketing dollars were being spent and how that translated back to their overall subscription sales – until now. Using UTM parameters within the Recharge Analytics dashboard will help understand your return on ad spend and can contribute to future growth.
Categories


