
Transform subscription data into business strategy
Reliable data, intuitive dashboards, intelligent recommendations. Everything you need to grow your brand at your fingertips.
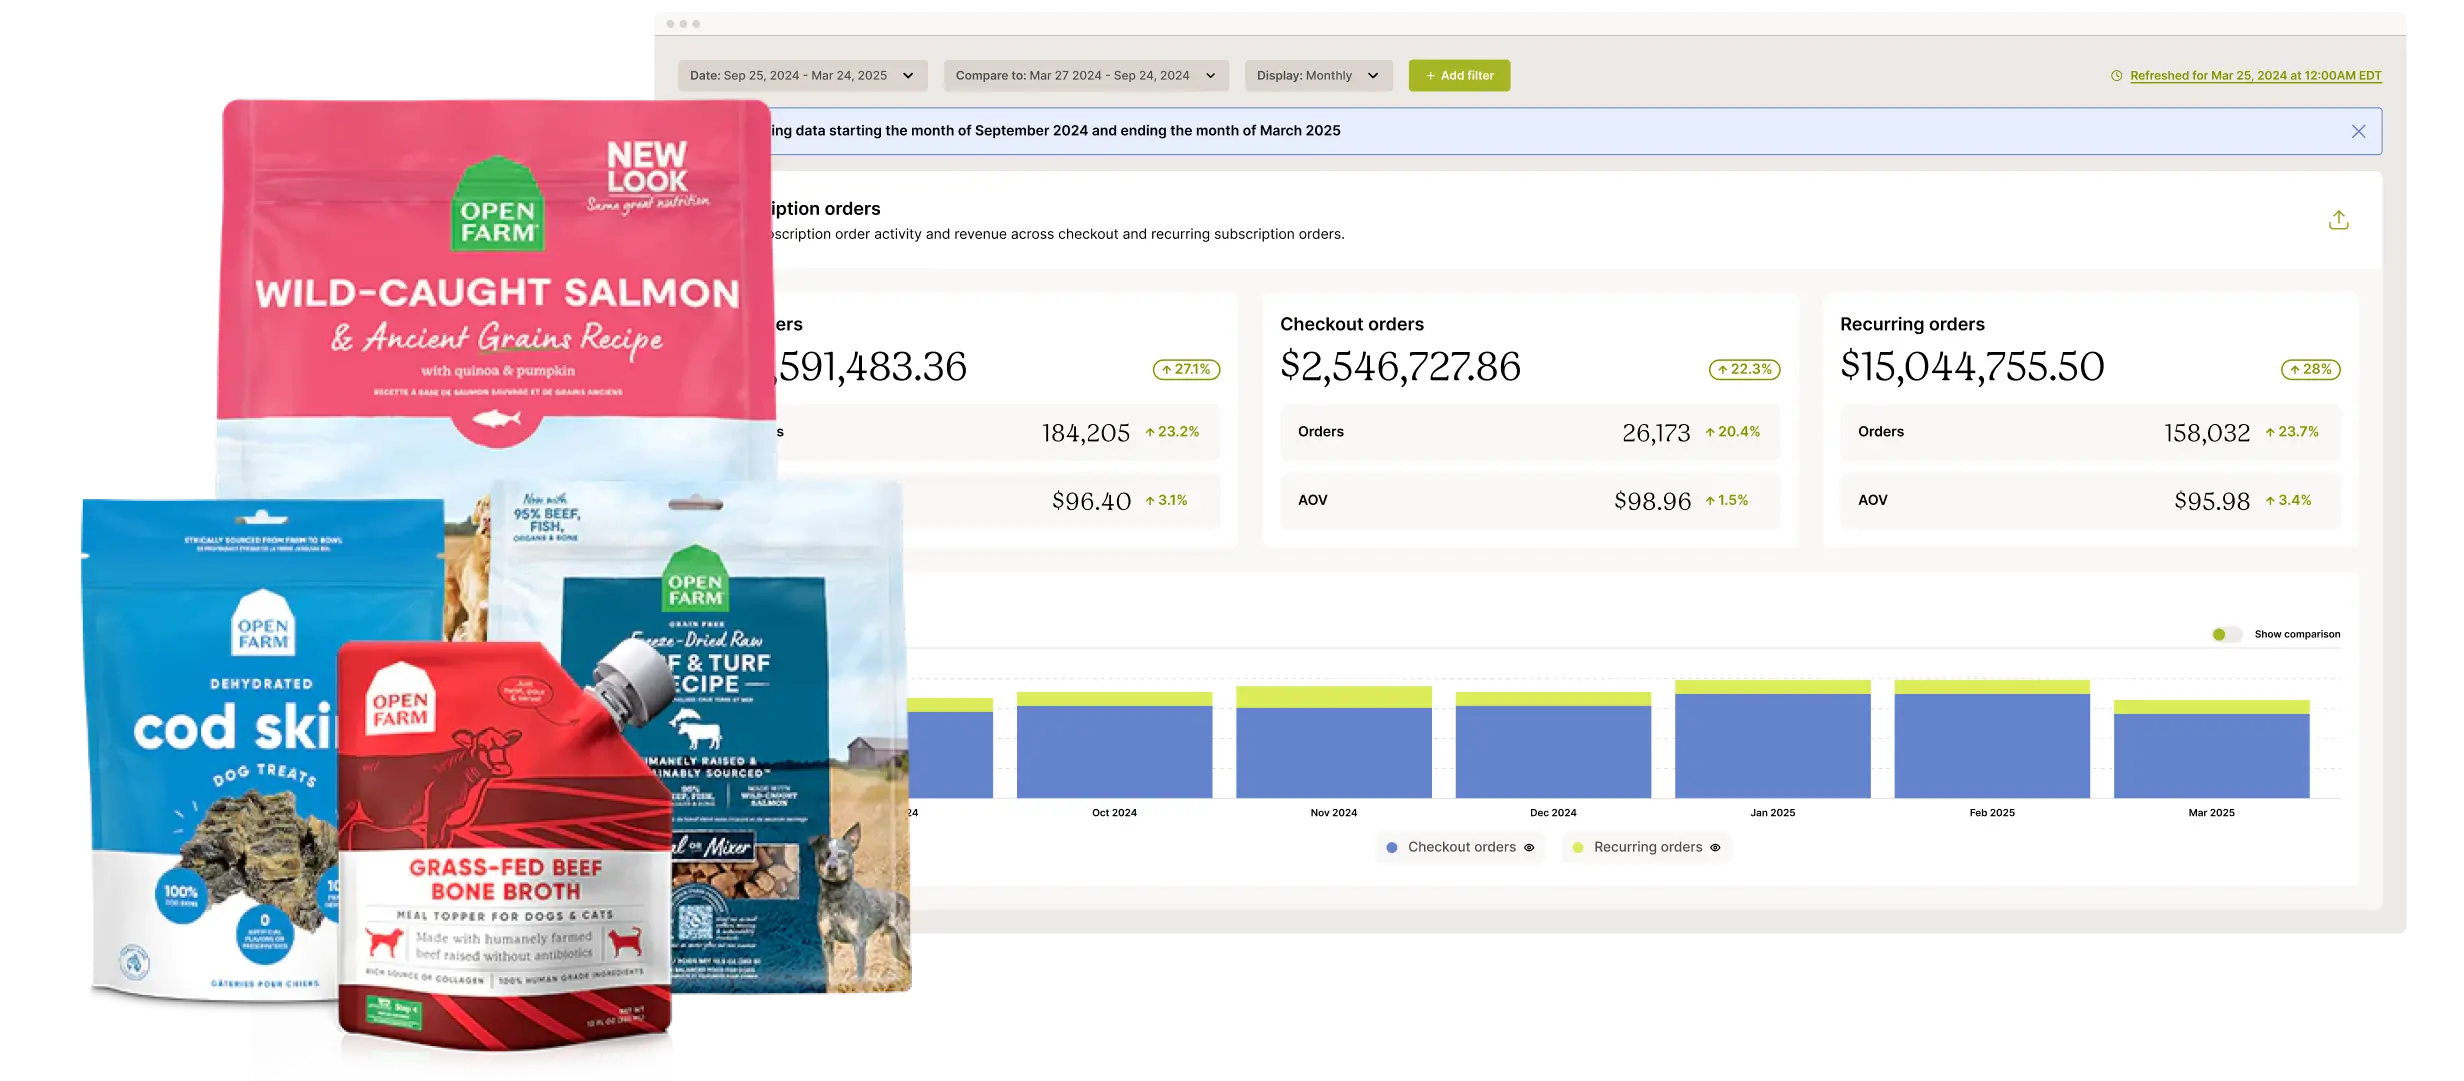
Our data helps grow these top brands


Why our data is the best
Intelligent data
Grow your business faster with data and insights from 20,000+ brands and 100M+ subscribers on Recharge.
Instant insights
Get the data you need, instantly. Just ask ✦ Remi, your AI analytics partner. No dashboard hunting required.
Smart filters
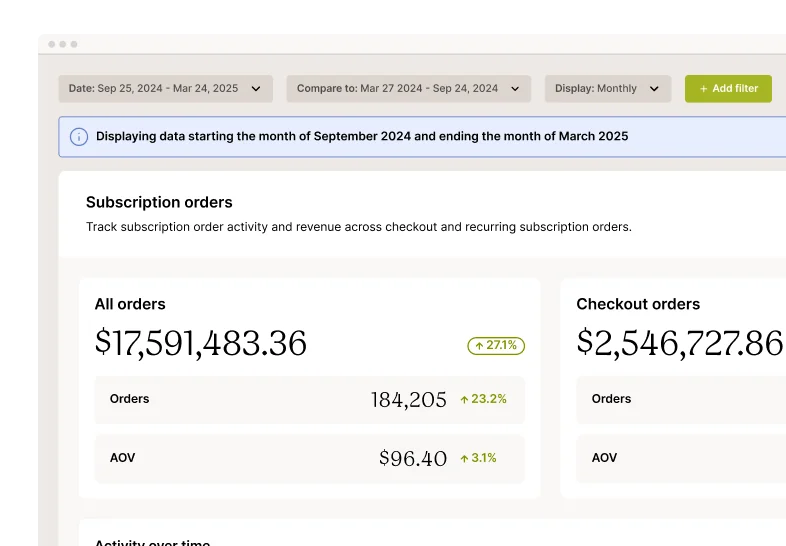
Quickly find and focus on the data that’s most important to you, with simple filters and easy-to-use display controls.
Your subscription data, inside your AI tools.
The Recharge MCP connects your store’s subscription analytics to Claude, ChatGPT, or any AI assistant that supports MCP. Ask questions in plain language, schedule reports, and combine Recharge metrics with your other connected tools, using the same numbers you see in your dashboards.
-
Why did my churn rate go up last month?
Your assistant pulls the relevant Recharge metrics, compares them, and explains what drove the change.
-
Every Monday, post my subscriber and churn summary to Slack.
Set it up once in your AI assistant, and your numbers arrive where your team already works.
-
Will I have enough stock for next month’s subscription orders?
Your assistant compares upcoming subscription demand with inventory from Shopify and flags shortfalls before they happen.

Understand what drives your business forward
Power subscriptions growth with insights from your data—and data from over 40,000 brands on Recharge.
-
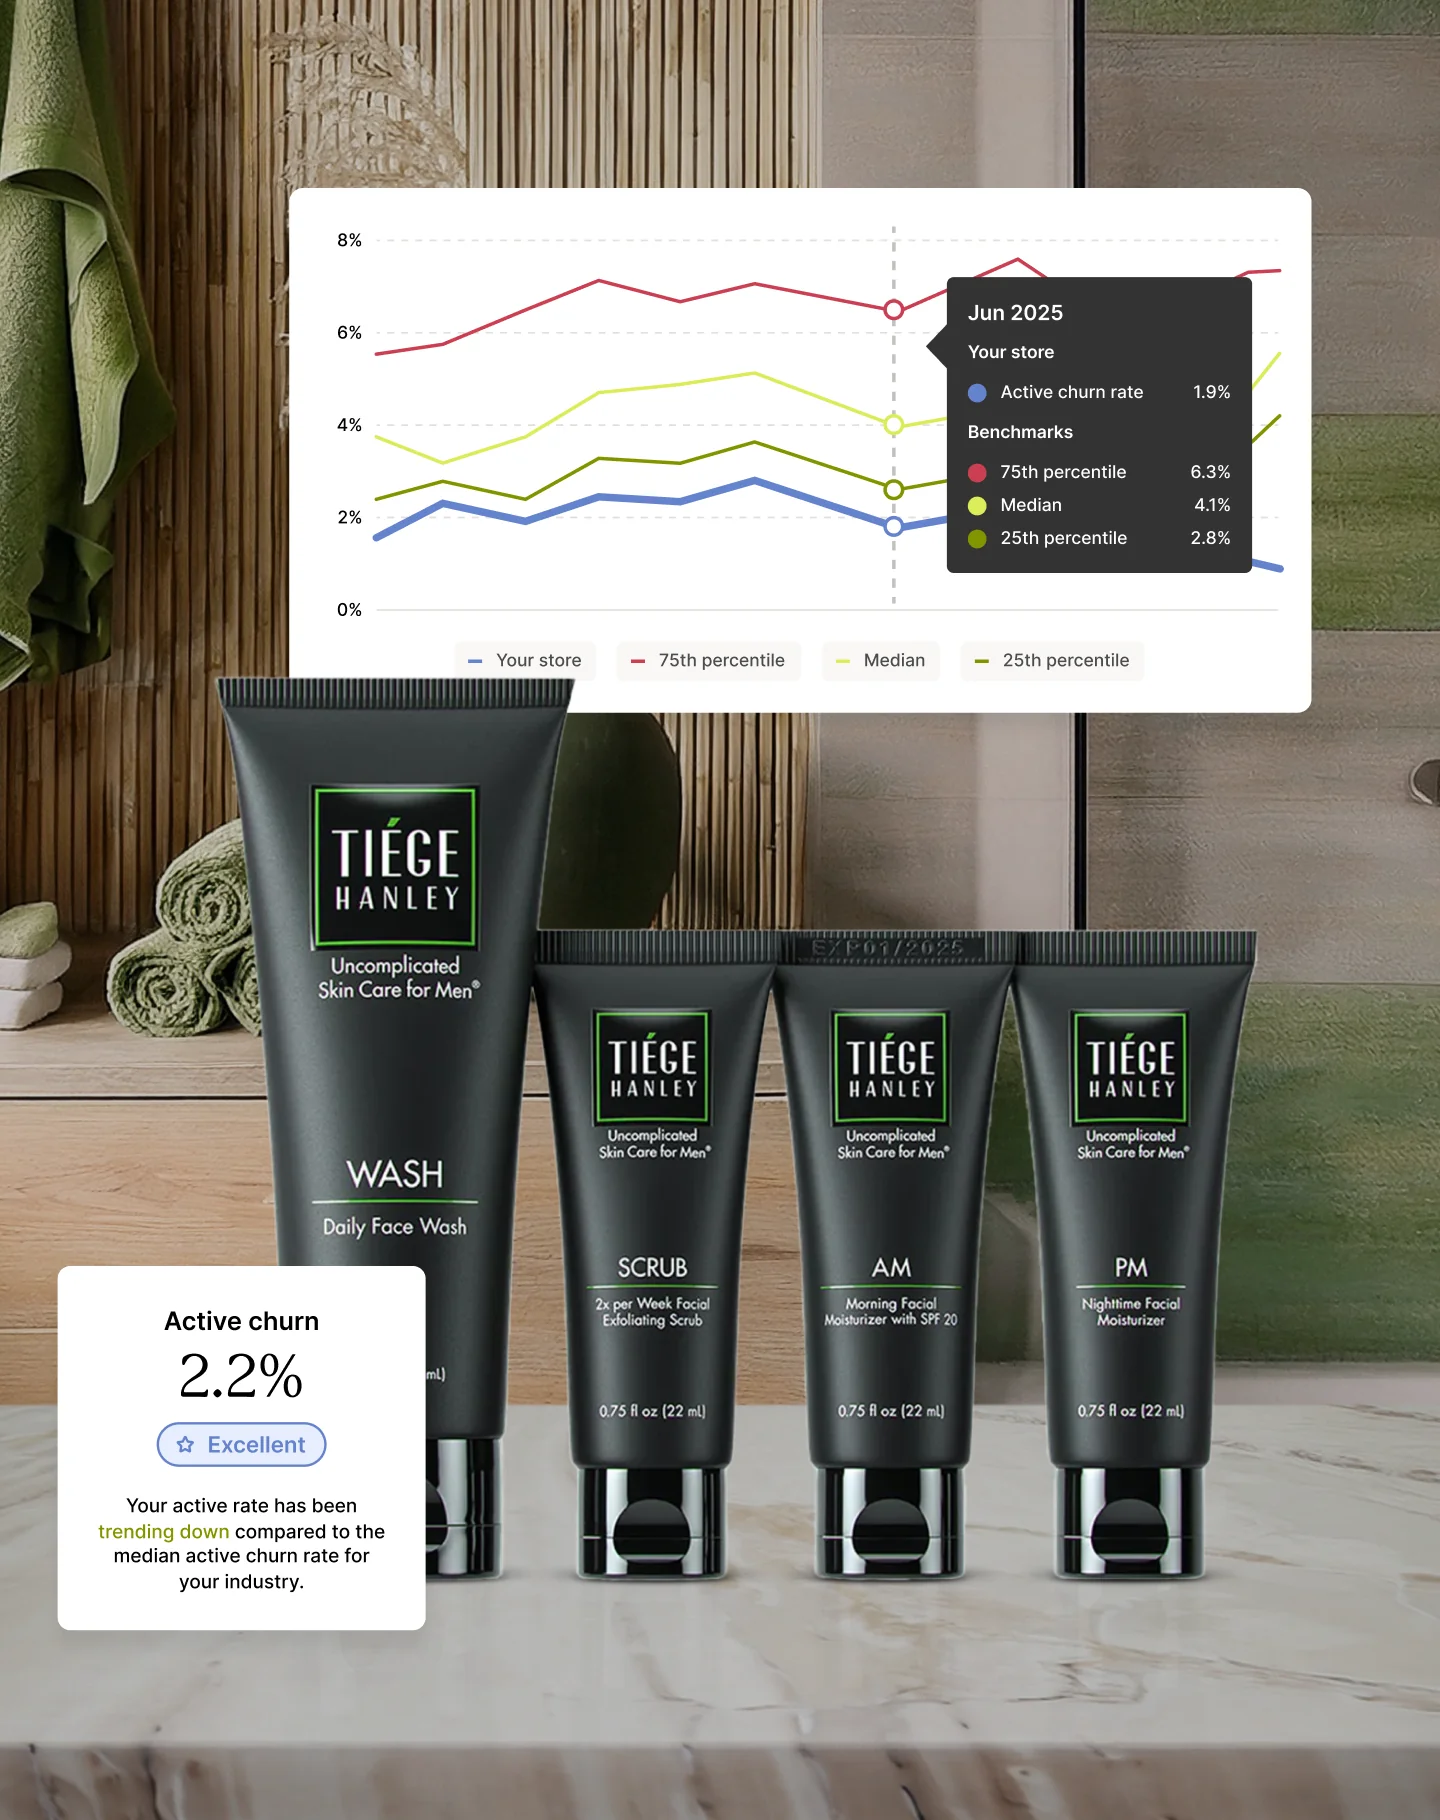
Contextualize your performance with Benchmarks
Compare your KPIs to brands like yours and understand how your performance measures up.
-
Visualize trends in performance over time
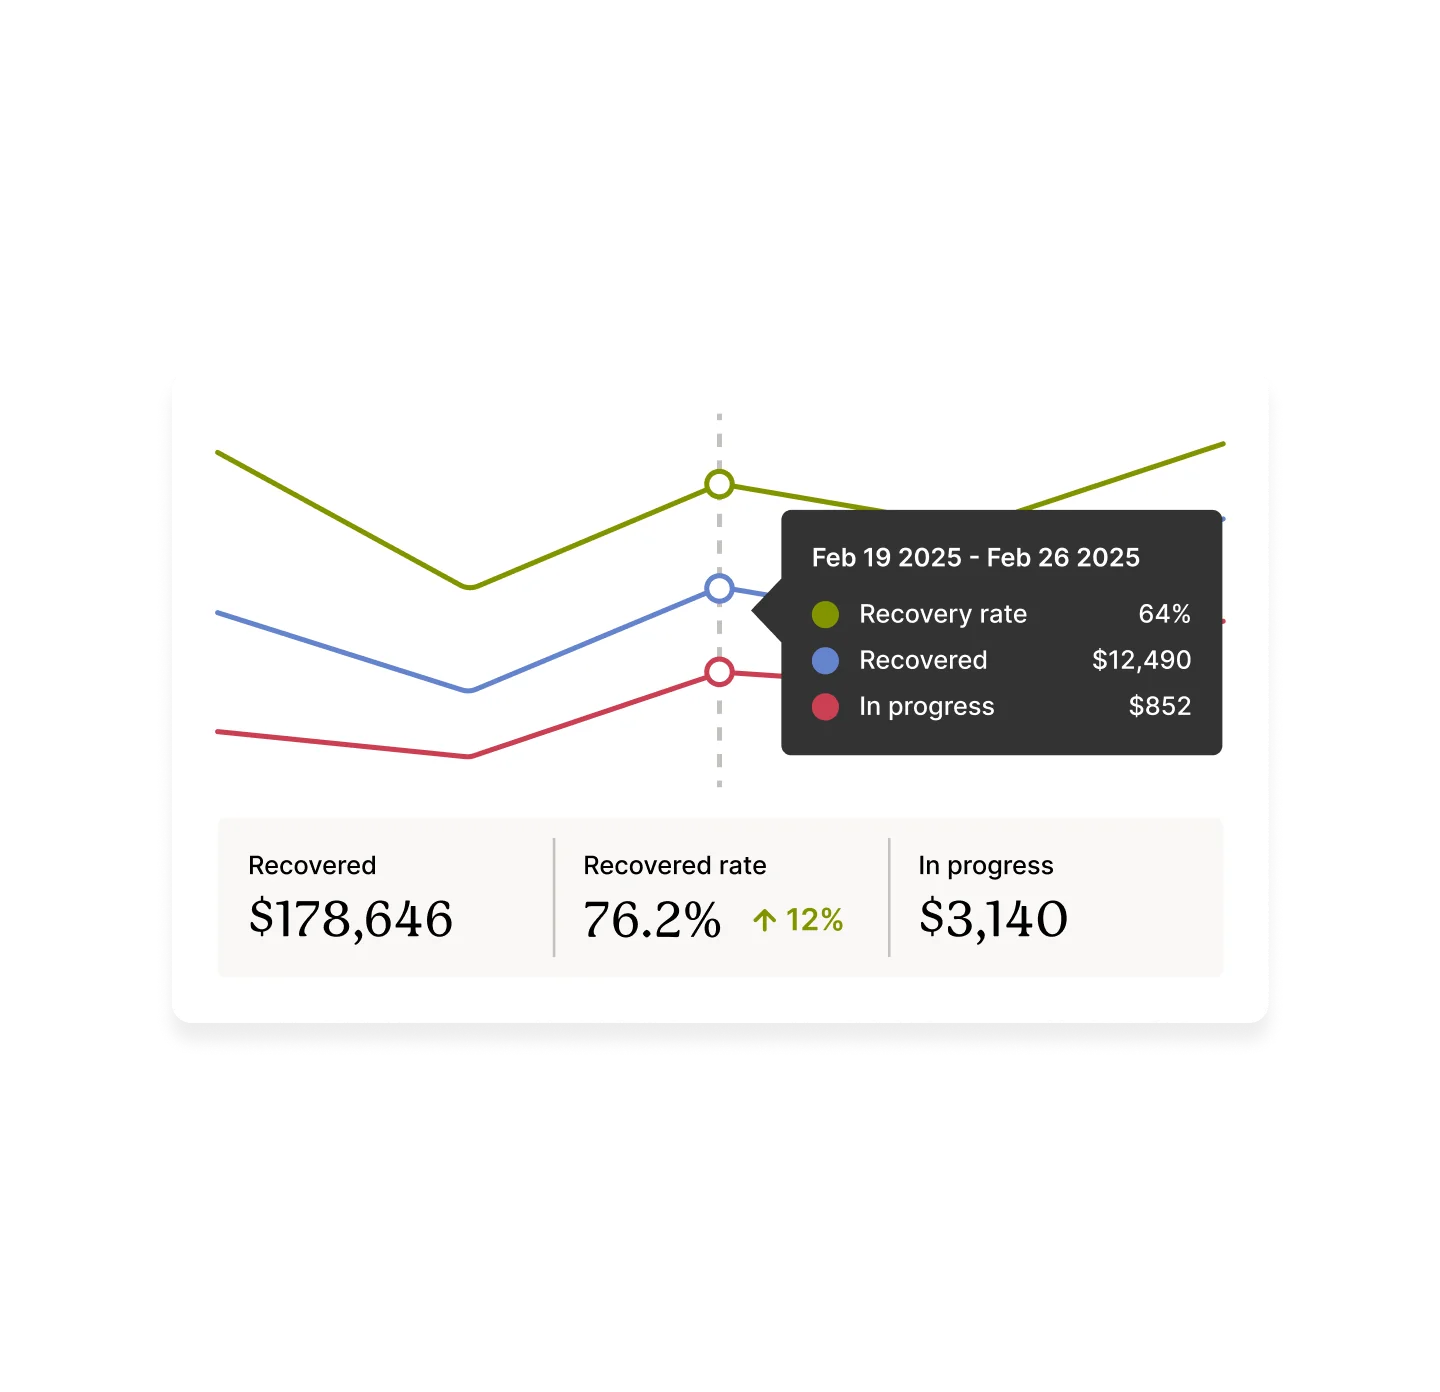
Track your brand’s performance over time to identify growth and retention trends, and stay informed about industry-wide trends.
-
Optimize your performance
Discover opportunities to improve with data-backed recommendations.
-
Build your own reports
Save reusable views around the products, segments, cohorts, and cadences your team monitors. Start from any Recharge report, set your filters, and come back to it.

Learn from loyal customers
Gain a unified view of the data that impacts your day-to-day.
-
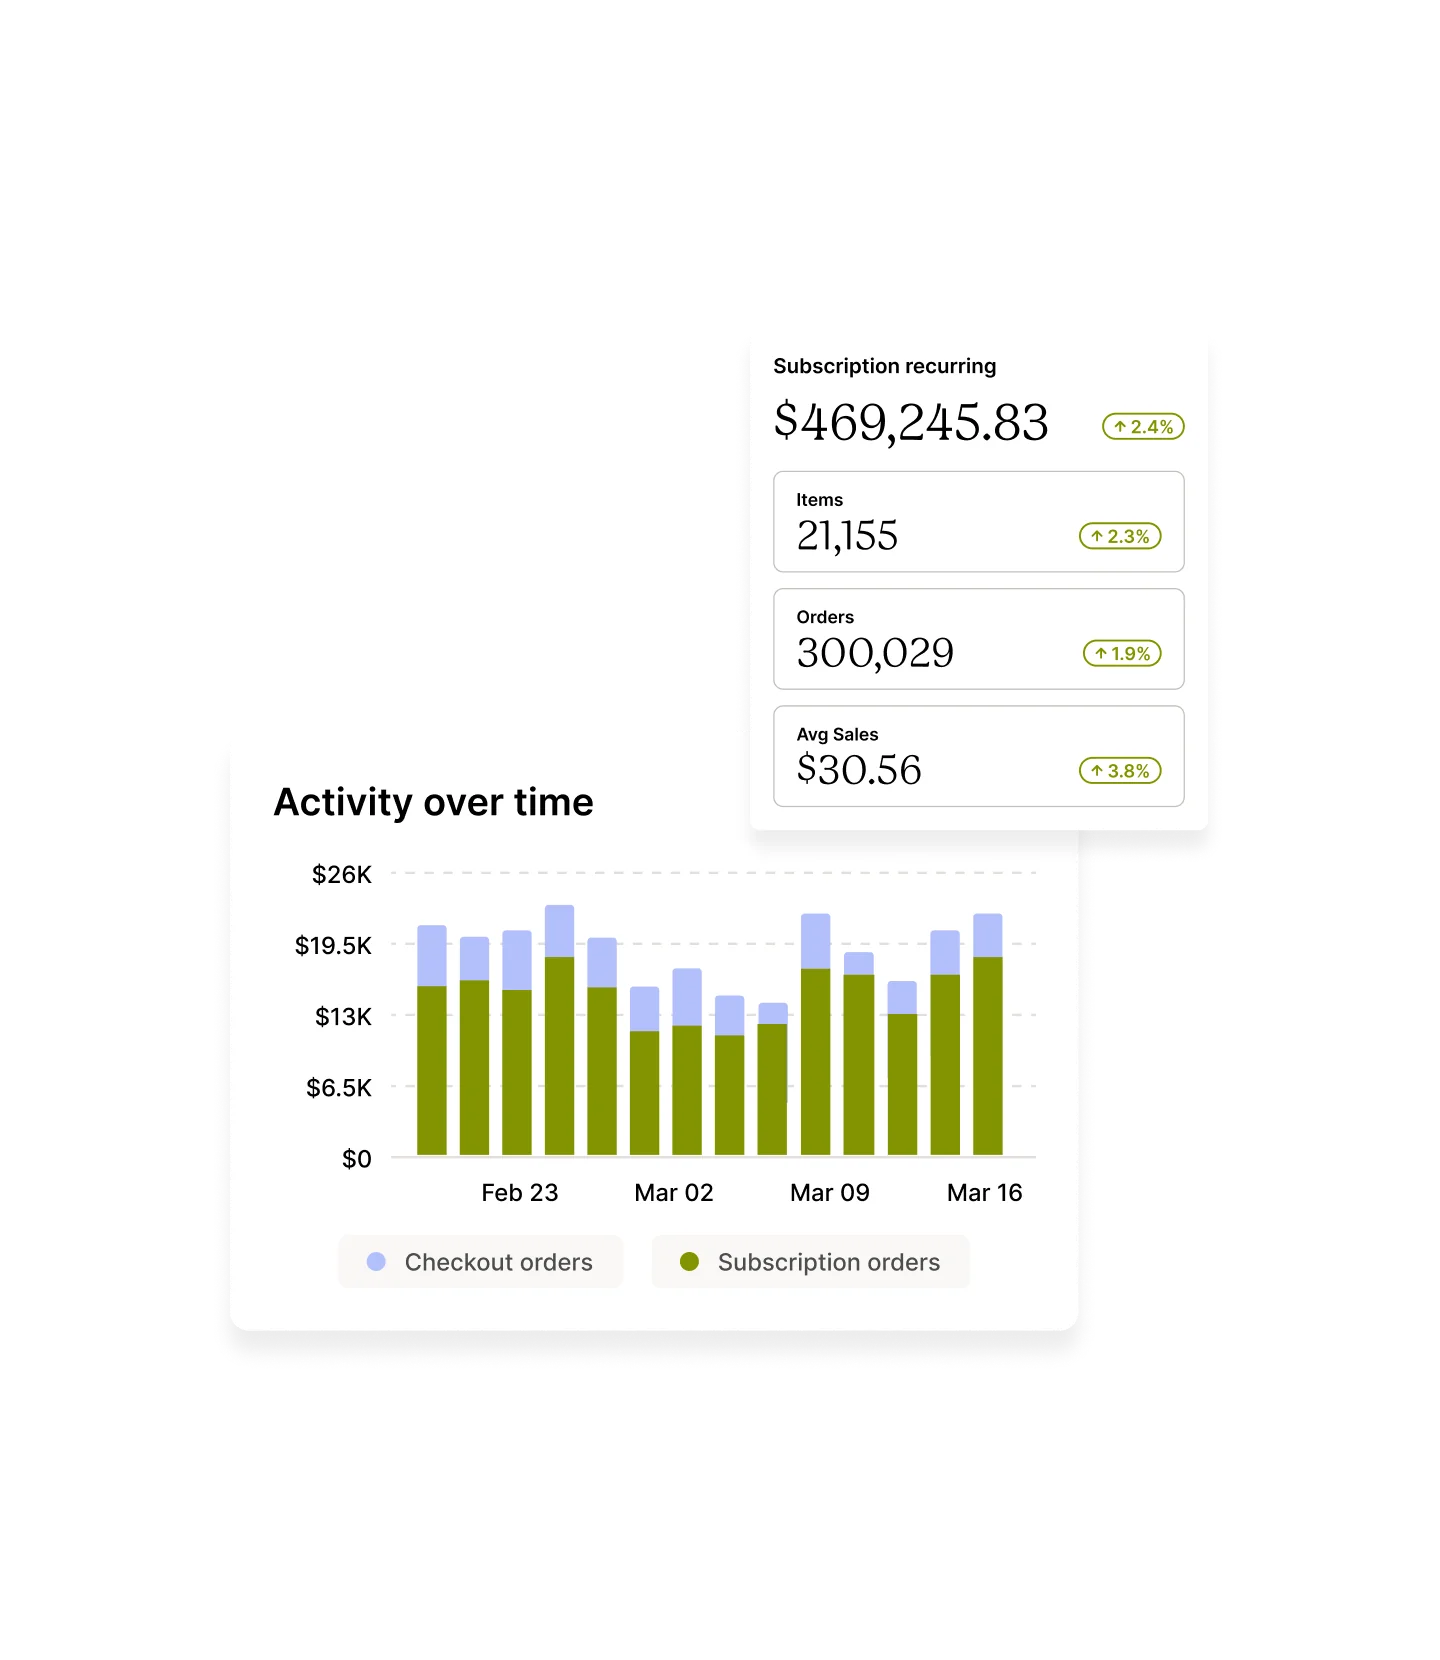
Know how much revenue your subscription sales are driving.
-
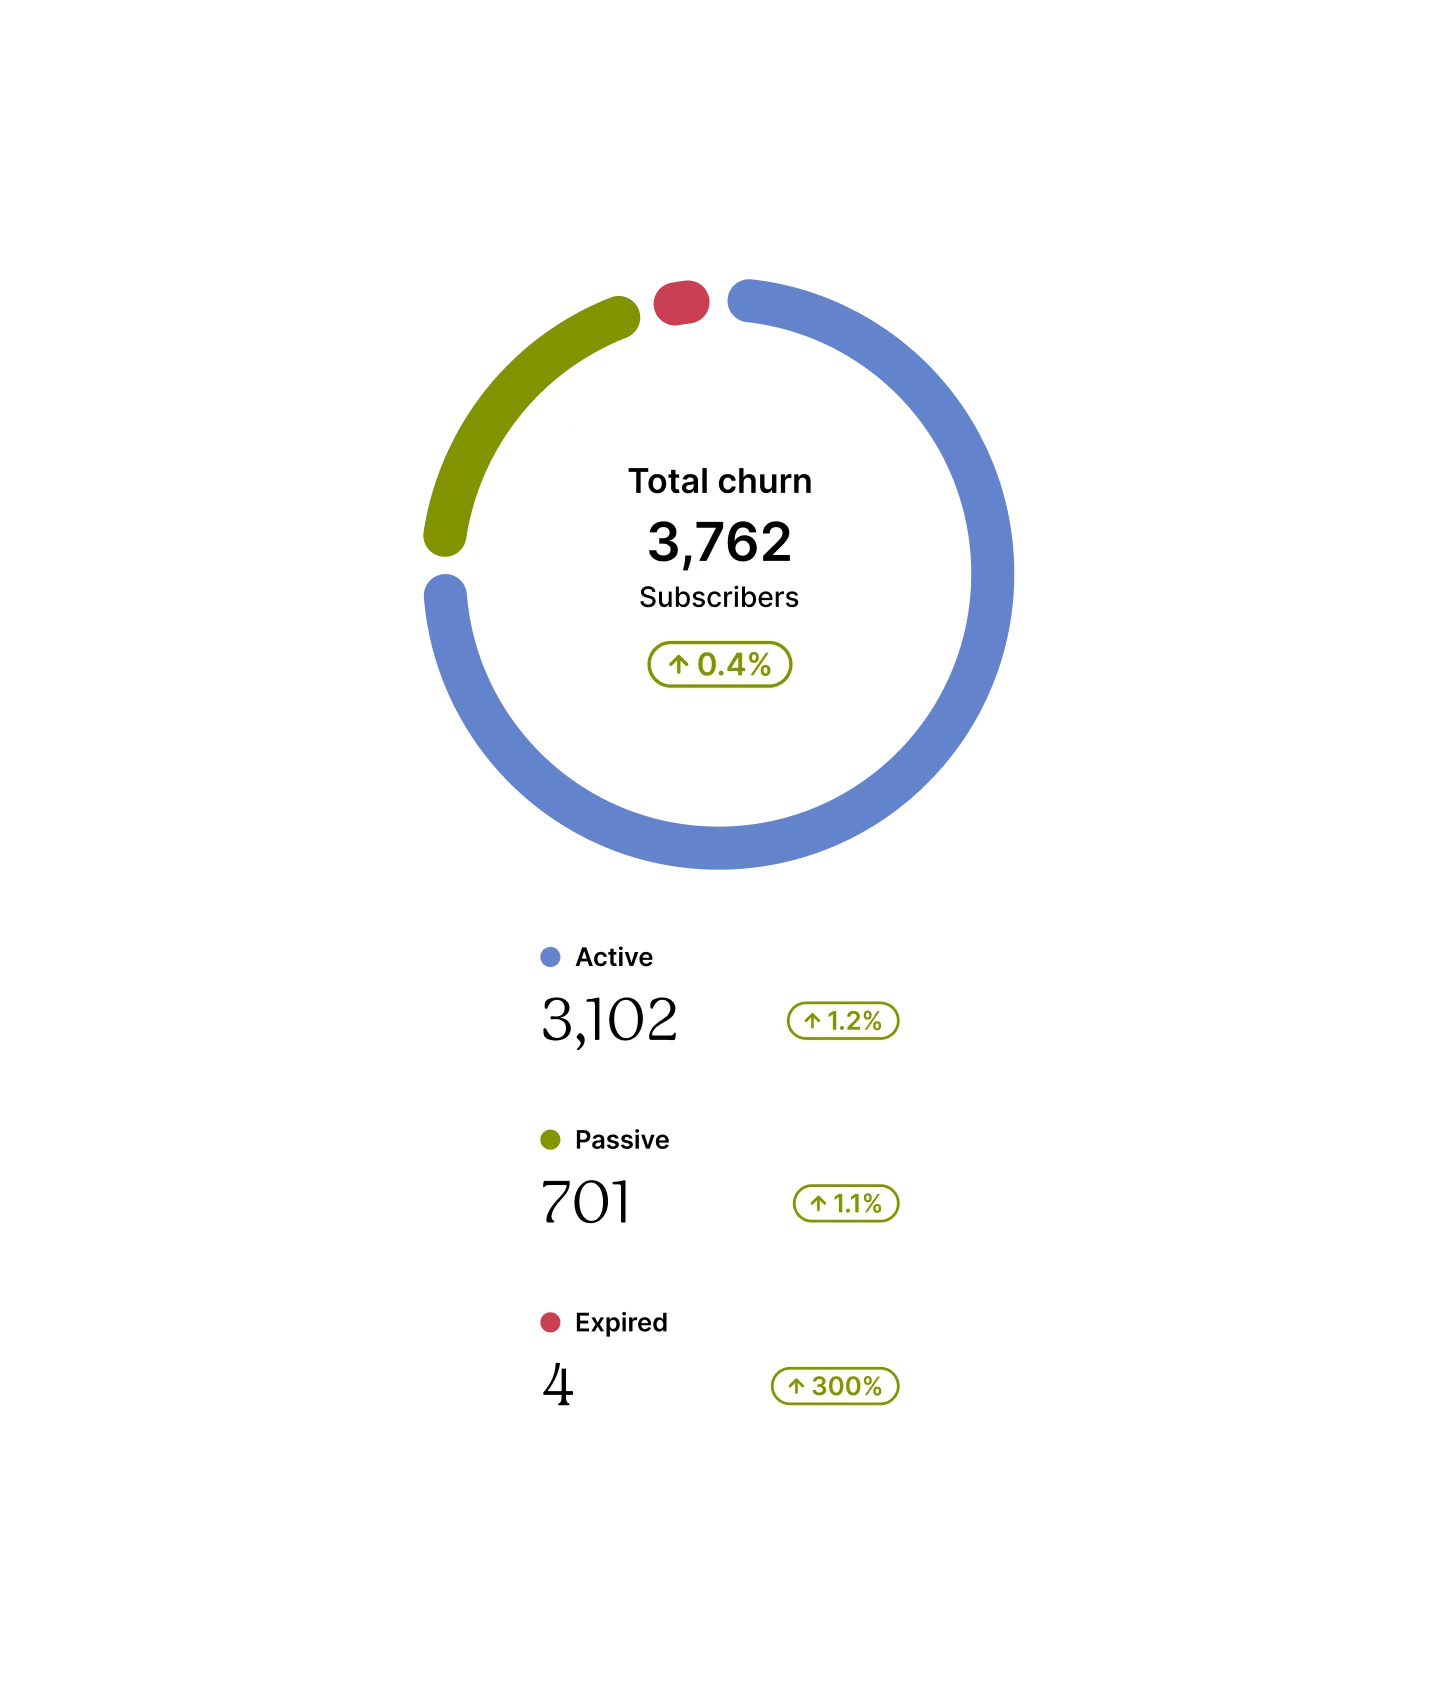
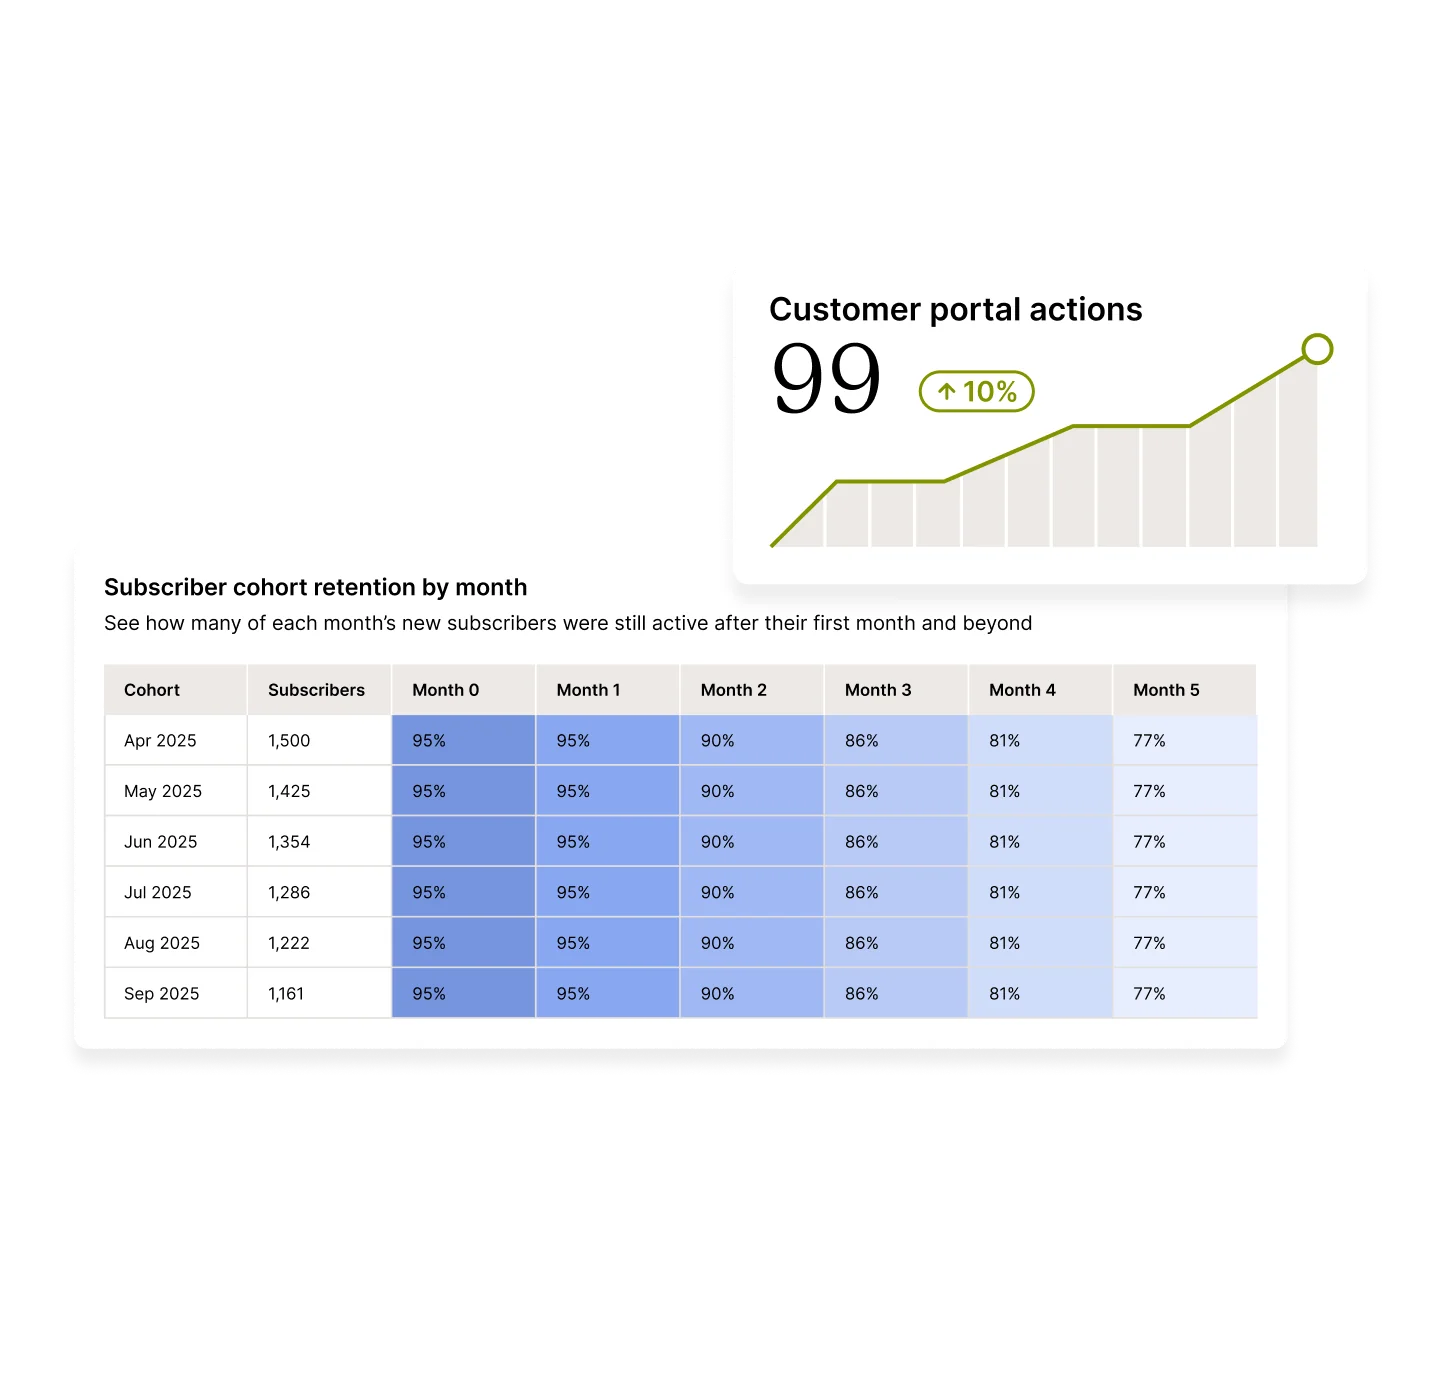
Understand trends in growth and retention among your subscribers and subscriptions.
-
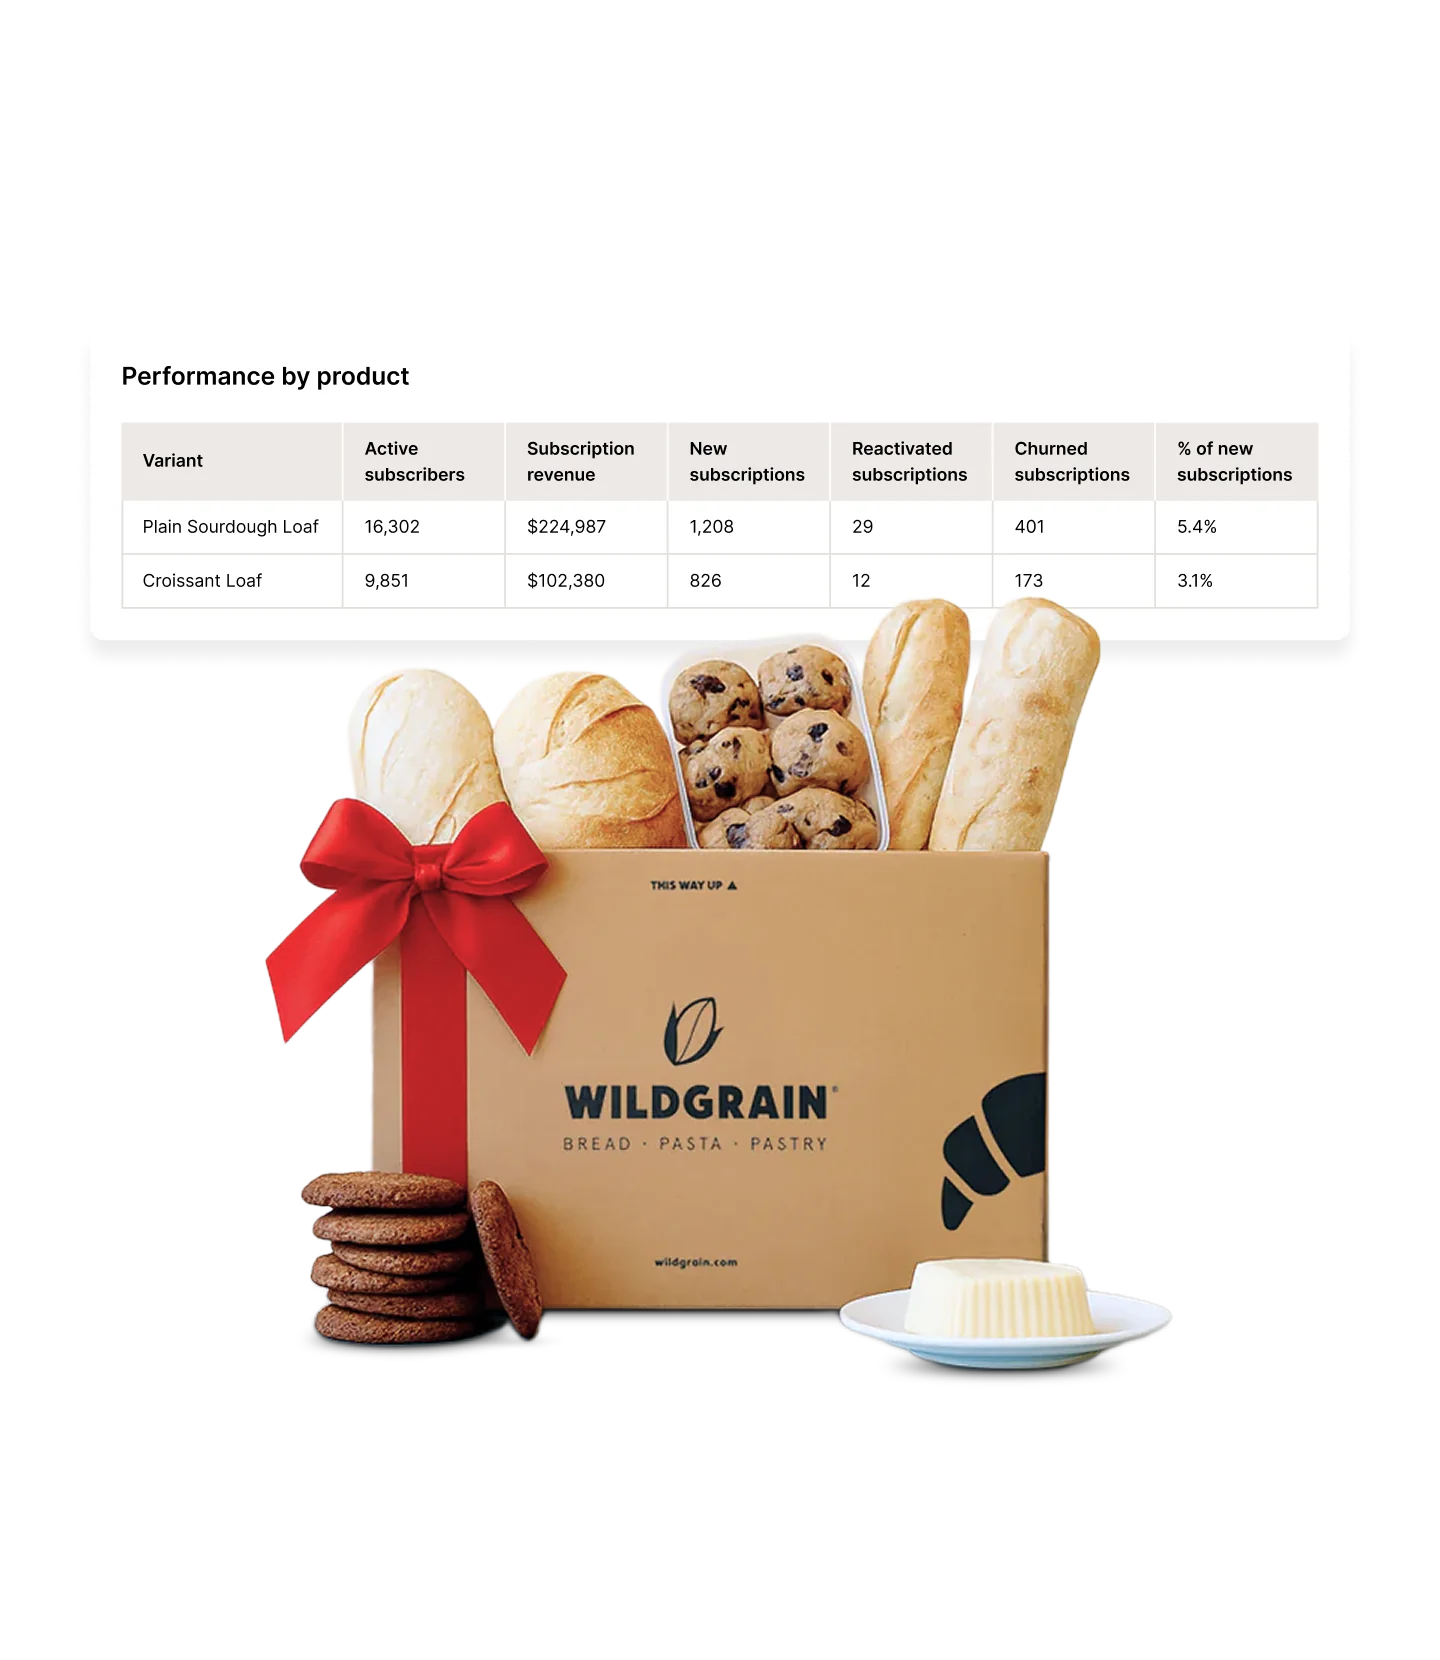
Learn which products and variants are most successful.
-
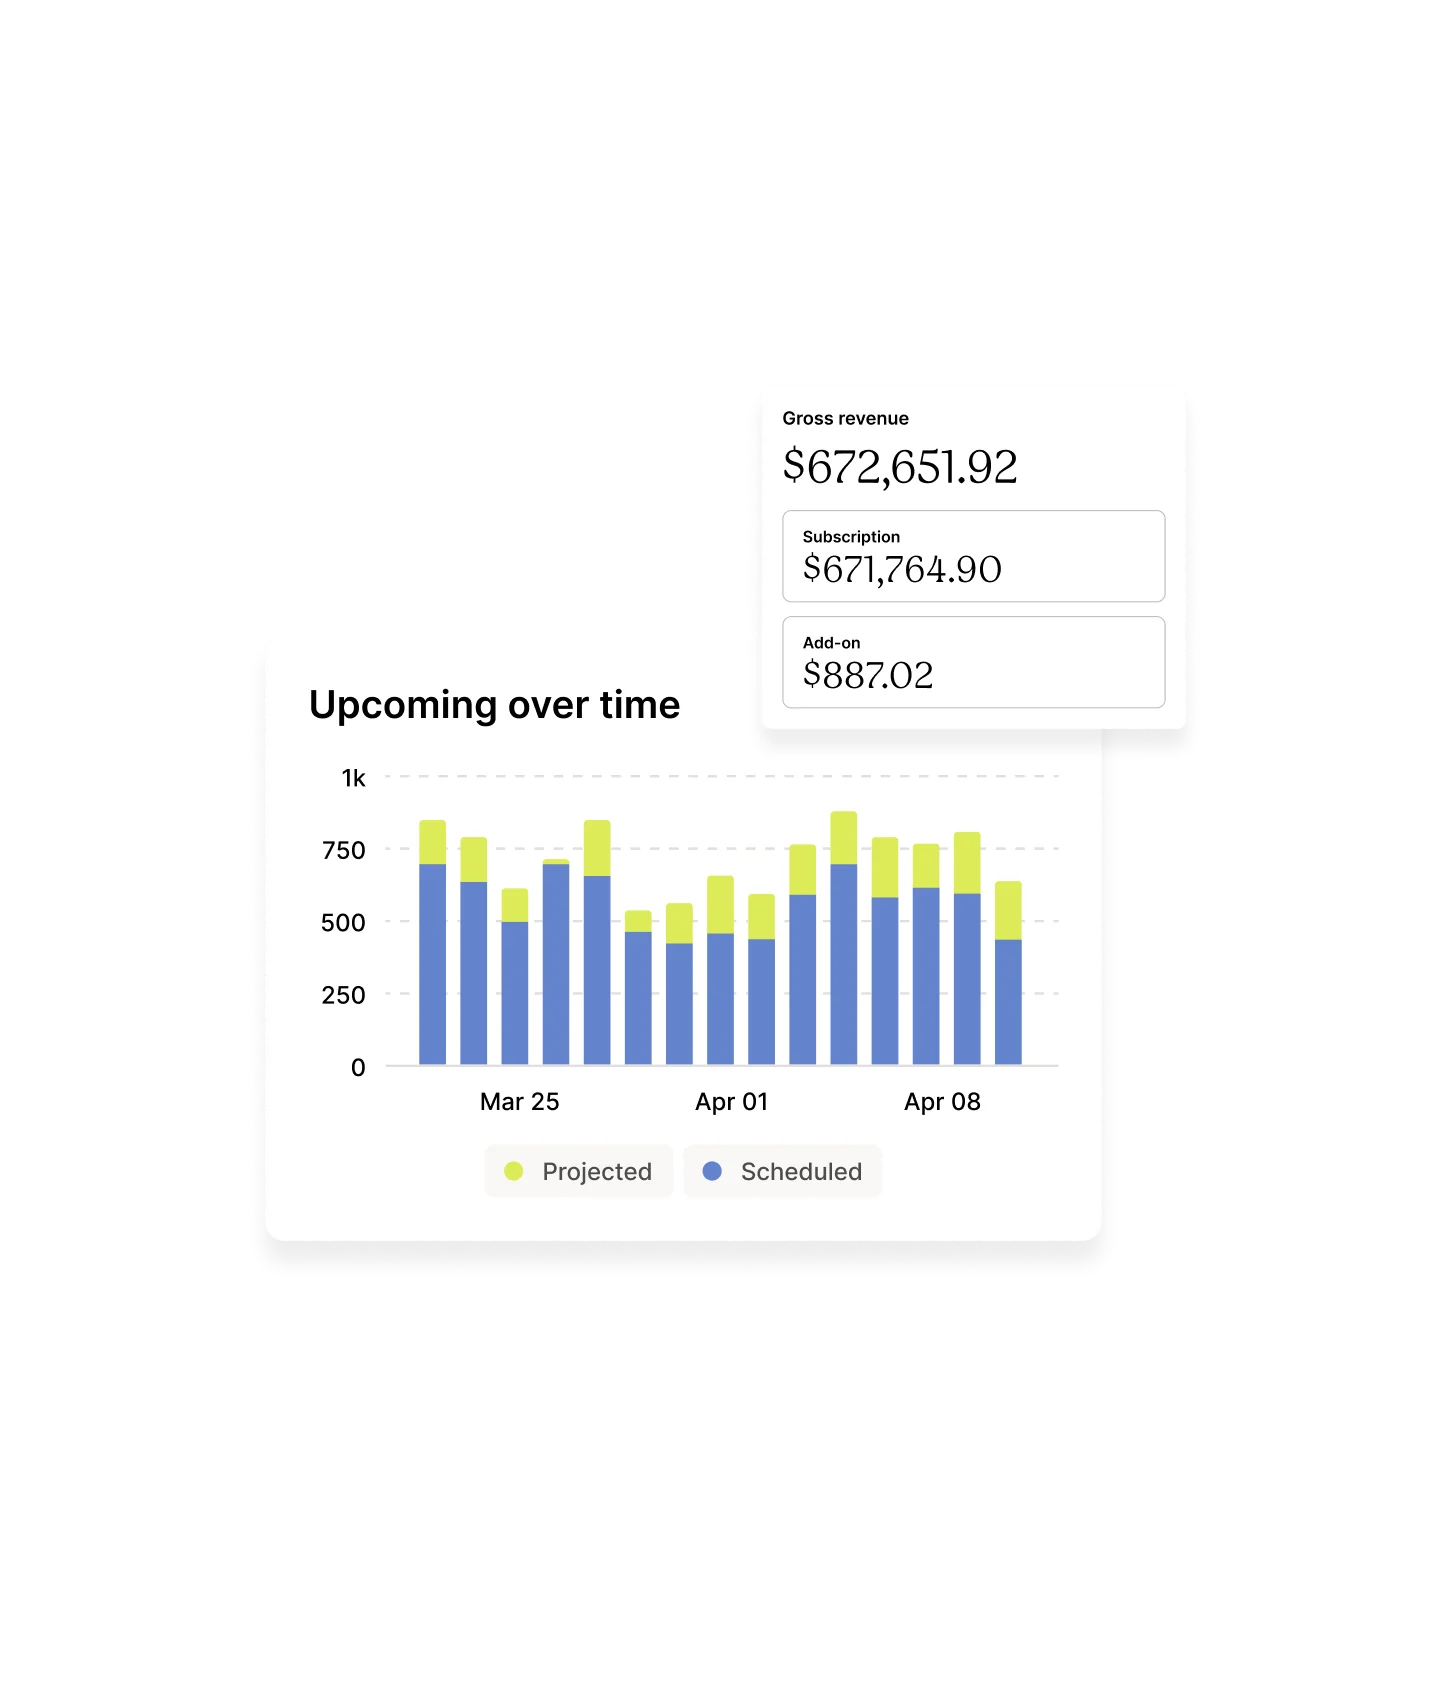
Project future revenue, anticipate inventory needs, and predict your subscription program’s performance over time.
Identify growth drivers
Inform every decision with data that identifies your most valuable customers moments, tactics, and more.
-
Dig deeper into your customers’ behaviors, from which subscription management actions they take to when they’re most likely to churn, and pinpoint the right moments for engagement.
-
Discover which tactics are meaningfully contributing to your goals—from discounted upsells, to cancelation prevention offers, to free gifts—and tailor subscriber experiences to maximize the value of each customer.
Ask Remi. Get the answer.
Remi is your AI analytics partner, built on the data behind your store. Unlike a generic assistant, it knows your numbers. No report to build, no dashboard to dig through. You always know where your business stands and what to do next. Just ask.
-
What was my subscriber churn rate last month?
Remi pulls your churn rate straight from your store’s data and answers in seconds, no report required.
-
How does this month’s subscription revenue compare to last?
Remi returns the month-over-month comparison instantly, from your store’s actual numbers.
-
How many new subscribers did I add last week?
Remi answers with your real subscriber count for the period, in plain language.
