
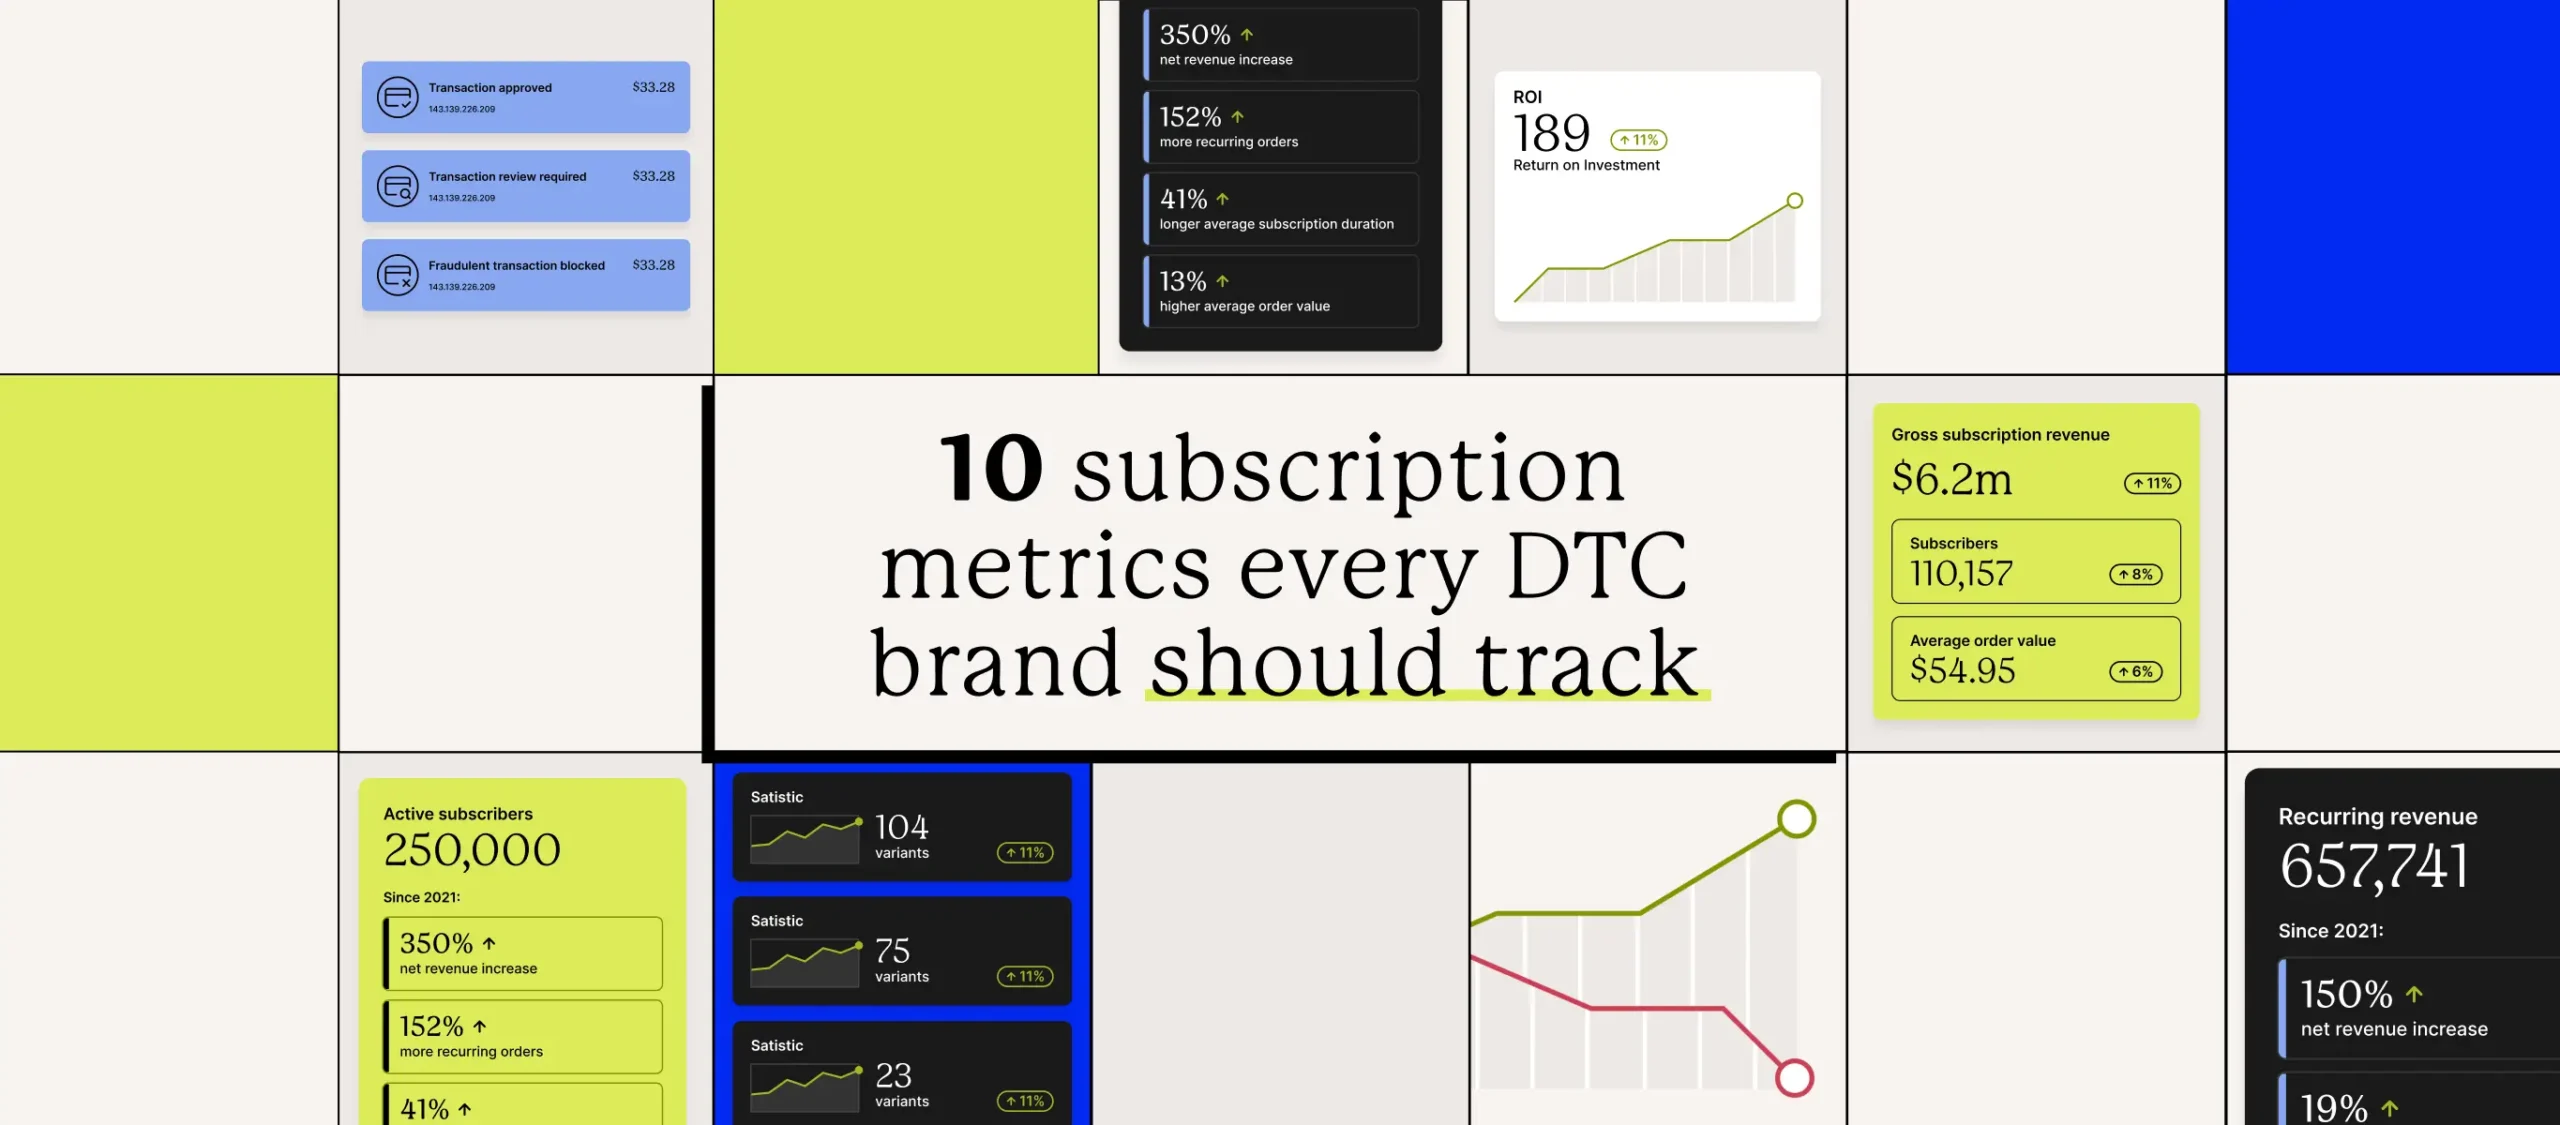
10 subscription metrics every DTC brand should track
Published November 2025
Published Nov 2025
Updated December 2025
Updated Dec 2025
8 min read
AI Summary
Subscription analytics guide direct-to-consumer (DTC) brands toward lasting growth. The right metrics not only track performance, but explain it. They show how customers engage, where revenue builds, and why loyalty strengthens or slips over time.
Subscription analytics guide direct-to-consumer (DTC) brands toward lasting growth. The right metrics not only track performance, but explain it. They show how customers engage, where revenue builds, and why loyalty strengthens or slips over time.
Recharge’s analytics tools make those insights clearer and more actionable. They tie data like retention, churn, and revenue directly to customer behavior, helping brands understand what’s happening, and why. With benchmarks drawn from over 20,000 merchants, operators can see where they stand, set smarter goals, and test changes with confidence.
The ten metrics below form the foundation of a healthy subscription business. Viewed through a strong analytics lens, they turn data into direction and insight into growth.
Acquisition and subscriber conversion metrics
1. Customer acquisition cost (CAC)
Customer acquisition cost measures the total marketing and sales investment required to bring in a new paying customer.
Formula: (Total marketing and sales spend ÷ Number of new subscribers). Spending $10,000 to acquire 100 new subscribers yields a CAC of $100.
The relationship between LTV and CAC determines profitability. A healthy business maintains at least a 3:1 LTV:CAC ratio, meaning every customer spends three times what it costs to acquire them. By analyzing CAC by channel or campaign, brands can see which marketing investments produce the highest-value customers.
2. Subscription checkout rate
Subscription checkout rate measures the percentage of total checkouts or transactions that include at least one subscription product. It highlights how effectively a brand drives subscription adoption at the point of purchase.
Formula: (Transactions containing a subscription ÷ Total transactions) × 100.
If 2,000 of 10,000 checkouts include a subscription, your Subscription Checkout Rate is 20%.
This metric bridges acquisition and retention by showing how well your brand communicates the value of subscribing. A high rate indicates that customers understand the convenience or savings of recurring orders. A lower rate might suggest that the subscription option isn’t positioned prominently or that incentives to subscribe are unclear. Improving this rate—through clearer messaging, stronger product placement, or well-timed subscribe-and-save offers—can significantly increase recurring revenue and long-term customer value.
Revenue and growth metrics
3. Monthly recurring revenue (MRR)
Monthly recurring revenue represents the total predictable revenue generated each month from active subscriptions. It is the heartbeat of any subscription business. Tracking MRR provides a clear snapshot of financial health and supports accurate forecasting for future growth.
Formula: The total of all recurring subscription fees collected monthly, excluding one-time charges or discounts. For example, 100 subscribers paying $50 and 200 paying $25 produce $10,000 MRR.
As subscription volume grows, MRR becomes the foundation for evaluating stability and scalability. Monitoring trends over time helps identify seasonality, promotional impact, and growth inflection points. Segmenting MRR by product line, customer cohort, or acquisition channel reveals where the most sustainable revenue originates.
4. Average order value (AOV)
Average order value measures the average dollar amount spent per order or renewal, helping brands understand purchasing behavior and revenue potential per transaction.
Formula: Total revenue ÷ Total number of orders
For example, if your store generates $50,000 in revenue from 1,250 orders in a month, your AOV is $40.
To increase AOV, subscription brands often experiment with product bundling, personalized cross-sells, prepaid plans and quantity upsells. These strategies drive higher revenue per order without increasing acquisition costs, making AOV one of the most efficient levers for improving profitability.
5. Revenue growth rate
Revenue Growth Rate measures how quickly revenue increases or decreases over time. It reflects business momentum and overall scalability.
Formula: [(Current period revenue – Previous period revenue) ÷ Previous period revenue] × 100.
Tracking growth alongside MRR and retention rate provides a complete picture of performance. Consistent growth, even at moderate levels, signals healthy traction, while sudden changes can highlight the impact of marketing campaigns or seasonality.
Retention and churn metrics
6. Churn rate
Churn rate tracks the percentage of customers who cancel their subscriptions within a set period. It is often the clearest signal of customer satisfaction and product-market fit.
Formula: (Customers lost during period ÷ Customers at start of period) × 100.
If you start with 1,000 subscribers and 50 cancel their subscription, your monthly churn rate is 5%.
High churn erodes predictable revenue and forces businesses into costly acquisition cycles. Common causes include weak onboarding, low engagement, lack of loyalty programs, or failed payments. Recharge automates churn prevention tactics such as failed payment retries and targeted retention offers, helping brands retain customers without manual intervention.
7. Retention rate
Retention rate measures how many subscribers remain active after a set period, the inverse of churn. Strong retention signals consistent value and a healthy subscriber experience.
Formula: [(Customers at end – New customers) ÷ Customers at start] × 100.
For example, starting with 1,000 customers, acquiring 100, and ending with 1,050 equals a 95% retention rate.
Even modest improvements in retention can have outsized effects. Research shows that increasing retention by just 5% can raise profits by over 25%. Recharge enables brands to improve retention with flexible subscription management, loyalty features, and automated engagement flows that maintain long-term customer relationships.
8. Cancellation recovery rate
Cancellation recovery rate, sometimes referred to as Save Rate, measures the percentage of customers who stay subscribed after beginning the cancellation process. It’s a key indicator of retention effectiveness.
Formula: (Recovered subscriptions ÷ Total attempted cancellations) × 100.
If 200 customers begin cancellation and 60 decide to stay, your save rate is 30%.
This metric reflects how well your brand identifies and addresses cancellation intent. A high save rate means your retention flows, offers, and messaging are resonating with customers at the right time. Recharge’s Cancellation Prevention and dynamic retention tools make it easy to recover at-risk customers automatically, turning potential churn into renewed loyalty.
9. Customer lifetime value (LTV)
Customer lifetime value measures the average revenue a customer generates over a defined period, capturing both subscription and one-time orders. It shows the full value of each customer relationship, not just recurring revenue.
Formula: Total revenue from a customer cohort over a set period ÷ Number of customers in that cohort.
If 1,000 customers generated $120,000 in 12 months, the average LTV is $120 per customer. If subscribers generated $90,000 from 400 customers, their LTV is $225.
Many brands track a 12-month LTV to gauge overall performance, while others compare shorter timeframes, such as 3- or 6-month cohorts, to spot retention or revenue trends.
LTV helps determine how much to invest in acquisition and retention. Higher LTV means more room to spend on marketing, customer experience, and loyalty programs. Predictive tools can also forecast LTV by cohort to guide smarter, data-driven growth decisions.
10. Engagement metrics
Engagement metrics measure how actively subscribers interact with your brand beyond billing activity. These behavioral indicators often predict retention better than transaction data alone.
Key engagement signals include login frequency, order edits, email open rates, loyalty program participation, and customer support interactions.
High engagement usually correlates with longer subscription duration and higher spend. Tracking engagement helps brands proactively address churn risks. For instance, declining activity can trigger personalized reactivation campaigns through Recharge.
Frequently asked questions
What are the key subscription analytics metrics for DTC brands?
The most important metrics include subscription conversion rate, customer acquisition cost (CAC), monthly recurring revenue (MRR), average order value (AOV), churn rate, retention rate, customer lifetime value (LTV), customer acquisition cost (CAC), revenue growth rate, and engagement metrics. Together, these numbers provide a complete view of financial performance and customer behavior.
How do you calculate customer retention rate and why is it important?
Customer retention rate is calculated by dividing the number of customers retained at the end of a period by the number at the start, excluding new acquisitions, then multiplying by 100. High retention rates indicate strong satisfaction and compounding growth potential, since retaining customers is far more cost-effective than acquiring new ones.
What is churn rate and how can it be reduced in a subscription model?
Churn rate measures the percentage of subscribers who cancel during a specific period. Reducing churn involves improving onboarding, offering personalized retention incentives, recovering failed payments, and using analytics to identify at-risk customers before they cancel.
How is customer lifetime value (LTV) determined for subscriptions?
LTV measures the average revenue a customer generates over a set period, capturing both subscription and one-time purchases. It’s calculated by dividing total revenue from a customer cohort by the number of customers in that cohort. Most brands track a 12-month LTV to understand performance and guide acquisition and retention decisions.
How do you measure and lower customer acquisition cost (CAC)?
CAC is calculated by dividing total sales and marketing costs by the number of new subscribers acquired during the same period. Brands can lower CAC by optimizing marketing channels based on performance, improving conversion rates, and prioritizing acquisition of high-LTV customers.
How does Recharge’s analytics help brands make better decisions?
Recharge’s analytics suite gives merchants complete visibility into performance drivers at every stage of the subscription lifecycle from acquisition through retention. It reveals both what’s happening and why, surfacing actionable insights that inform pricing, product strategy, and engagement programs. Powered by data from over 20,000 merchants, Recharge provides benchmarks and best practices so brands can test, learn, and grow with confidence.
Categories

Related articles
Explore additional content that complements what you’ve just read.
Choosing the right payment processor for your DTC subscription program

The 6 Levers for Retention-Backed Growth In 2026

The First 30 Days: Where Your Retention Is Won or Lost

Retention Economics: Why growth is impossible without it

Why your ecommerce tech stack is critical for subscription growth and lower TCO